Cycle Time Performance Widget
A custom widget built for a client to analyze a team's cycle time performance over time and understand the impact of recently rolled-out AI capabilities on developer performance.
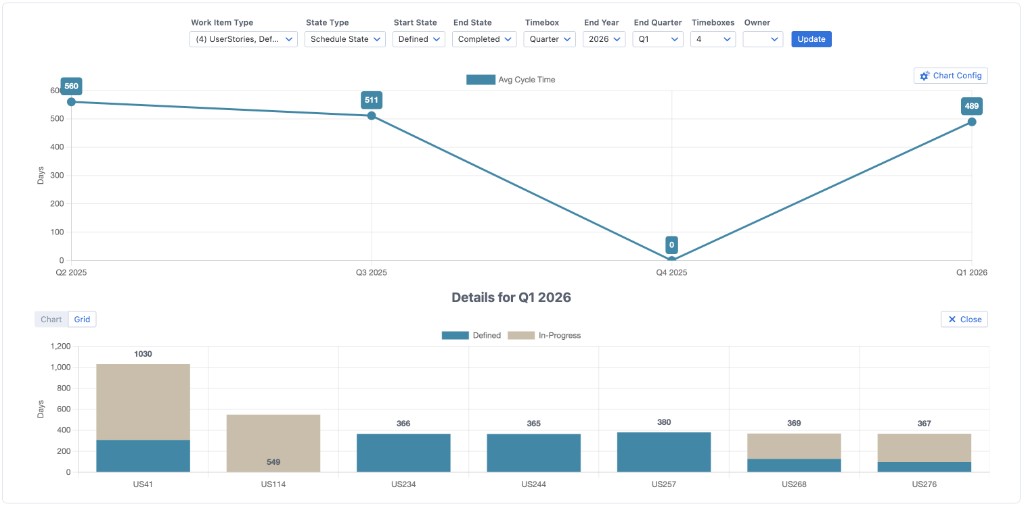
Cycle time over time with filters, timebox grouping, and drill-down details for a selected quarter.
Why this widget was built
The client needed a way to measure how new AI tooling was affecting delivery. Rather than relying on out-of-the-box reports, they wanted a single view that showed cycle time trends over configurable periods, with the ability to slice by work item type, state, and owner, and to drill into any point in time to see the underlying work items.
This custom widget exemplifies how we tailor Rally views to turn existing data into actionable insight—whether for performance analysis, compliance, or process improvement.
Features
- • Work item type & state type — Filter by type (e.g. User Stories) and state type (e.g. Schedule State) with configurable start and end states.
- • Timebox grouping — Group cycle time into iterations, releases, months, or quarters for the trend chart.
- • Configurable timeboxes — Show between 1 and 8 timeboxes on the chart (e.g. last 4 quarters).
- • Filter by owner — Restrict the view to a specific artifact owner when analyzing team or individual performance.
- • Drill-down details — Click any data point on the trend chart to see a detailed breakdown of the underlying work items (e.g. by story, with state breakdown) in chart or grid form.
Need similar insight for your data?
If the data exists in Rally, we can read it, transform it, and present it in a widget that fits your process. See how we build custom widgets or get in touch to discuss your use case.